⊞
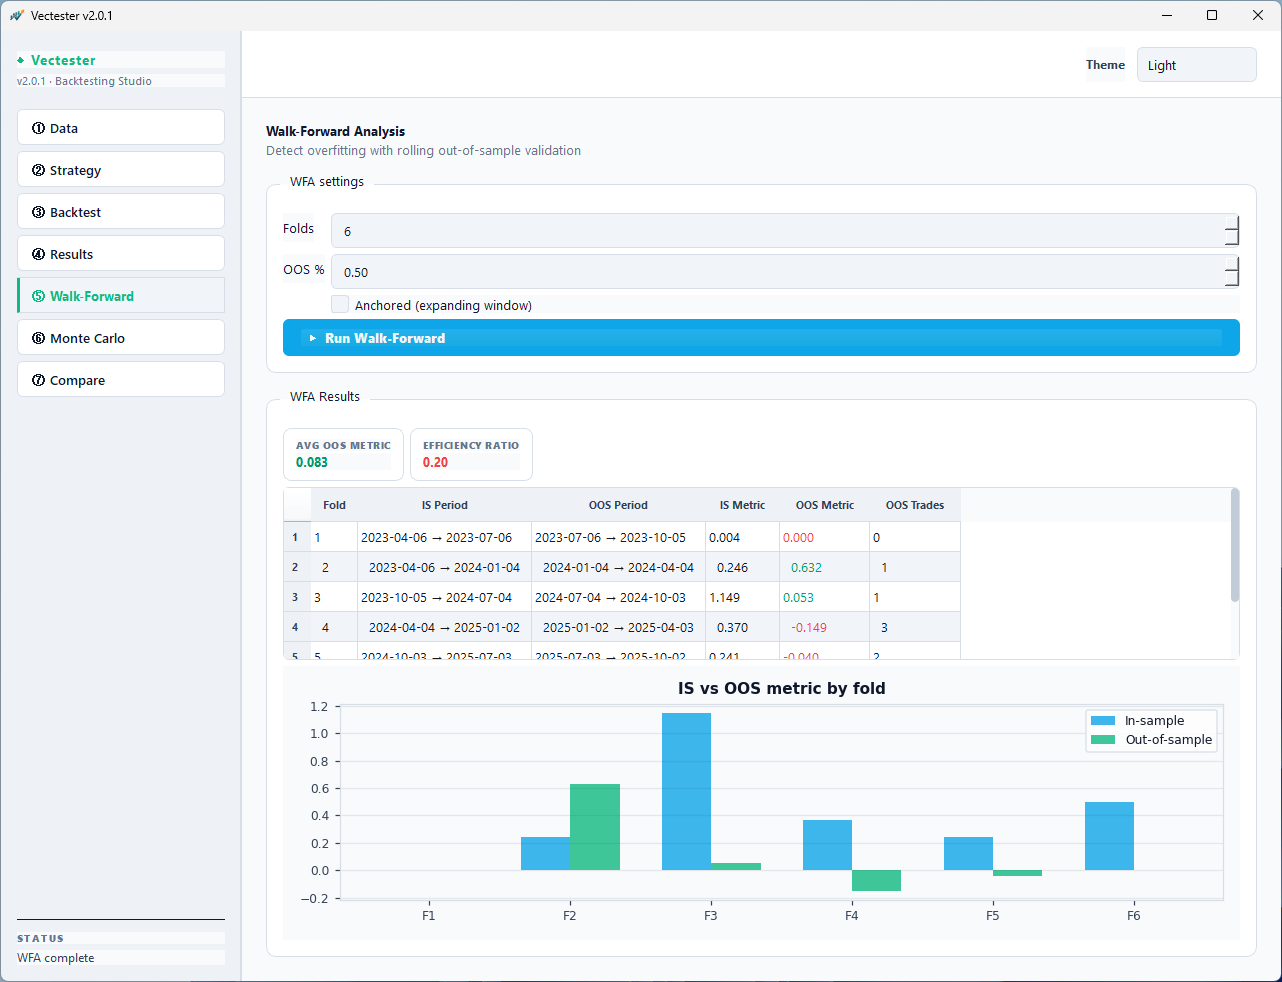
Walk-Forward Analysis
Rolling in-sample / out-of-sample validation across N folds. Efficiency ratio quantifies overfitting. The #1 tool serious quants need.
◈
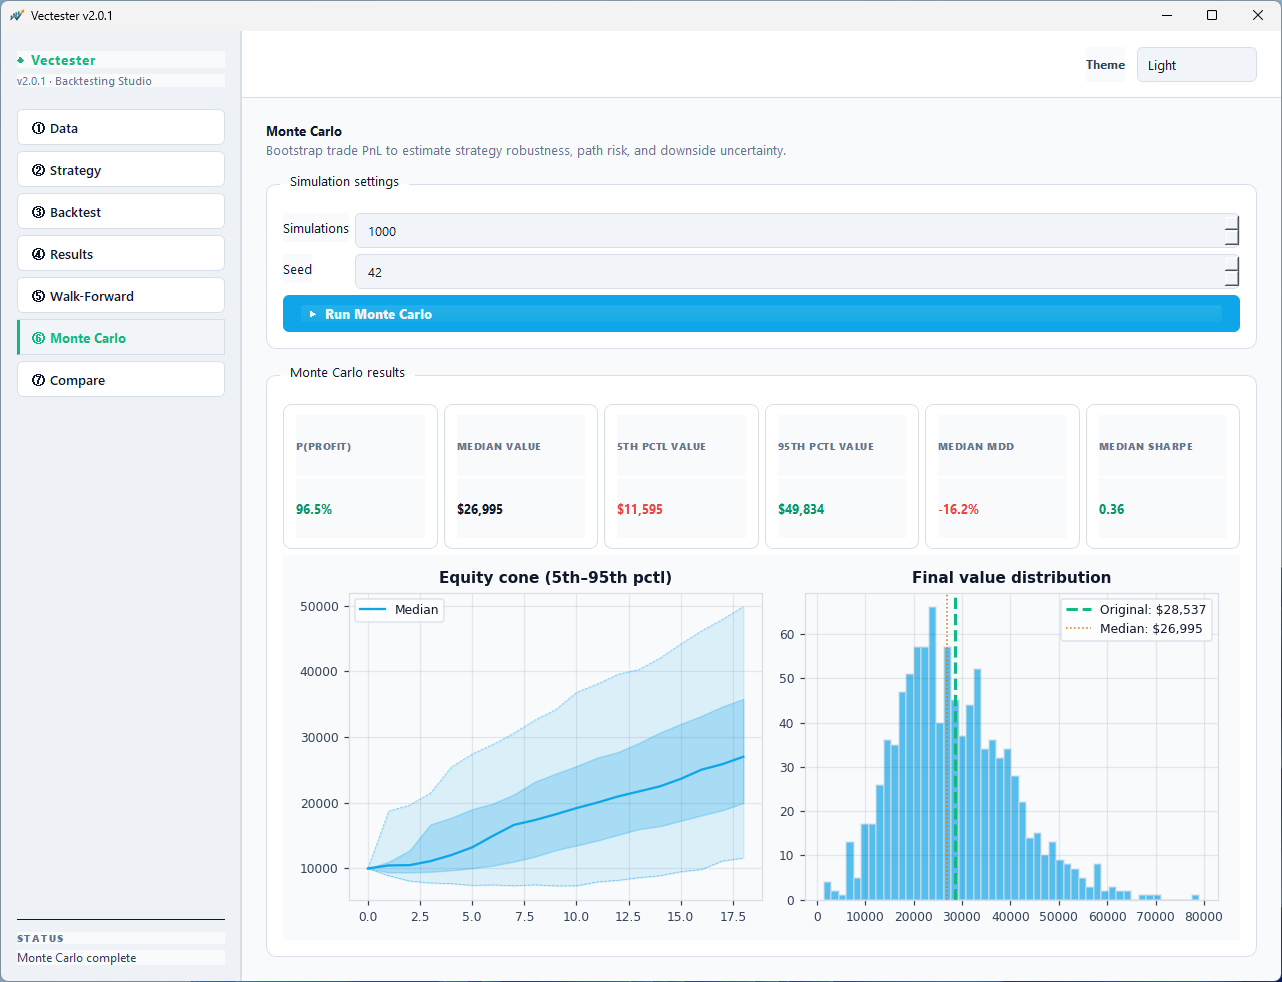
Monte Carlo Simulation
Shuffle trade P&L 100–10,000 times. Equity cones, confidence intervals, P(profit), and median drawdown tell you luck vs. edge.
⊕
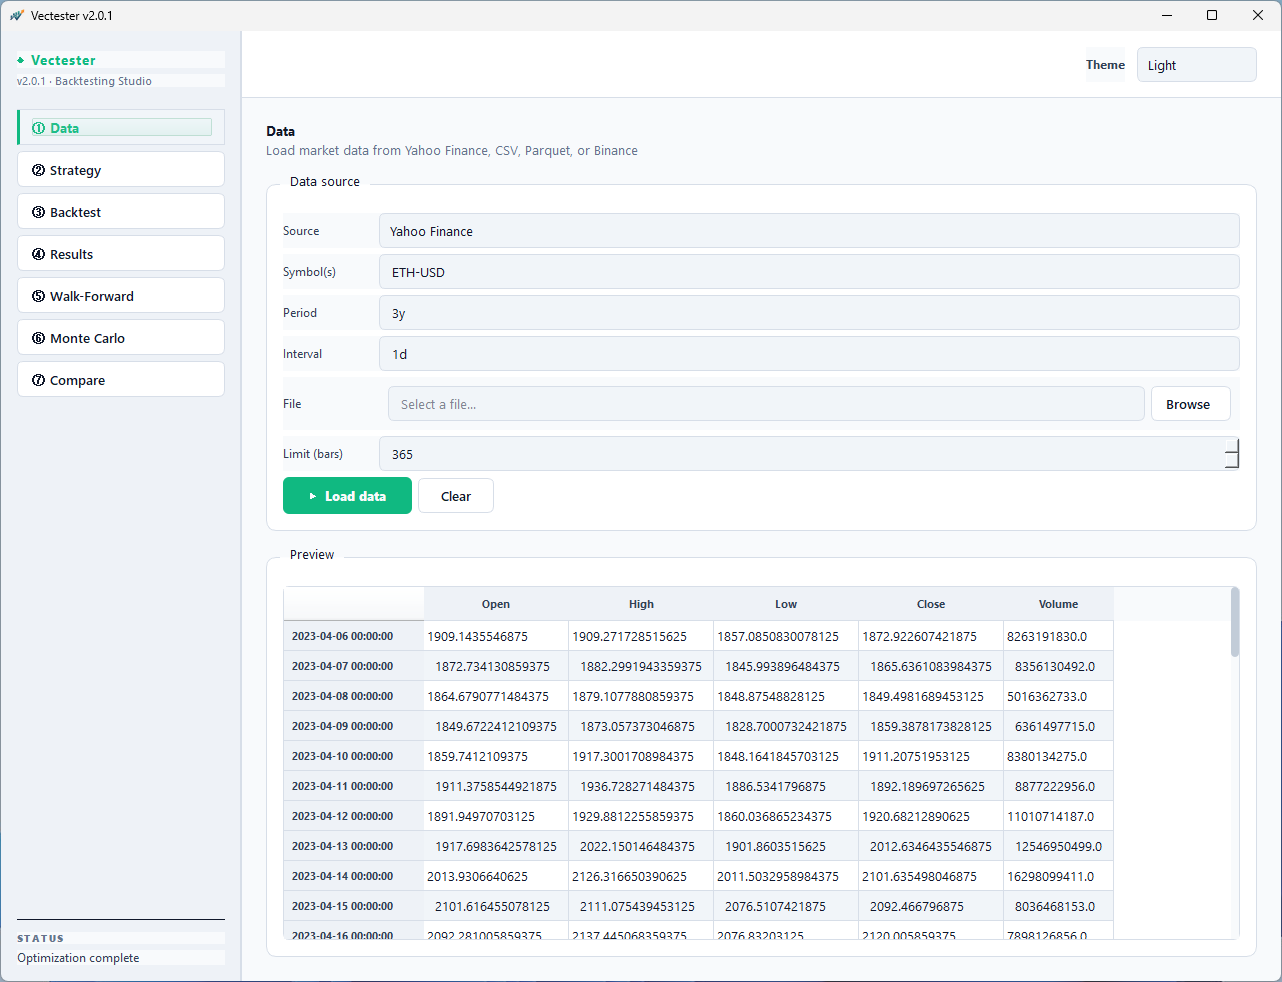
Multi-Asset Support
Comma-separated tickers for portfolio-level testing. Yahoo Finance, CSV, Parquet, and Binance via CCXT data sources.
⟐
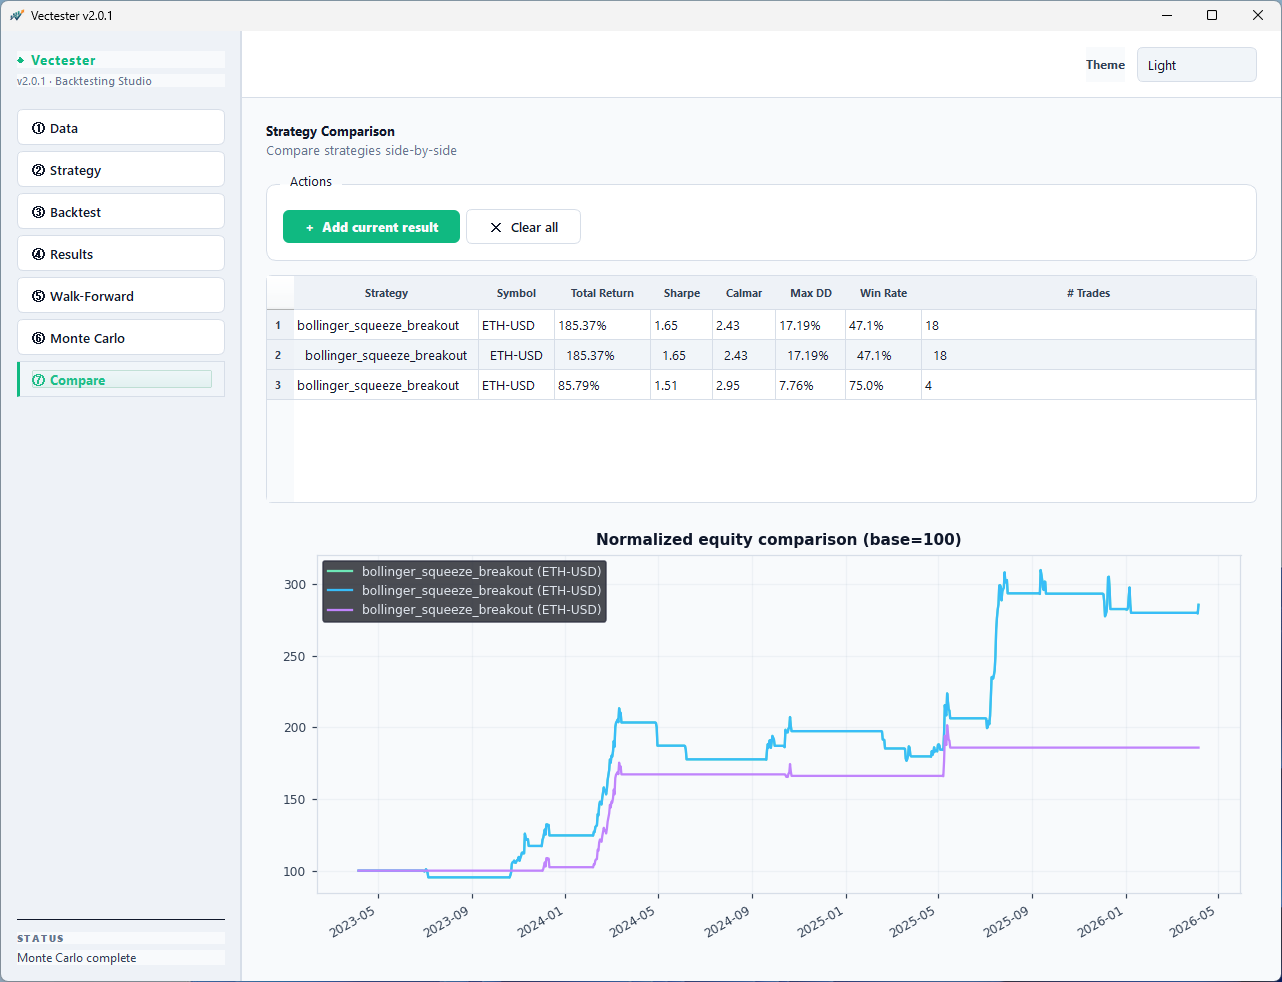
Strategy Comparison
Side-by-side table + normalized equity overlay. Compare Sharpe, Calmar, max drawdown, win rate across multiple runs.
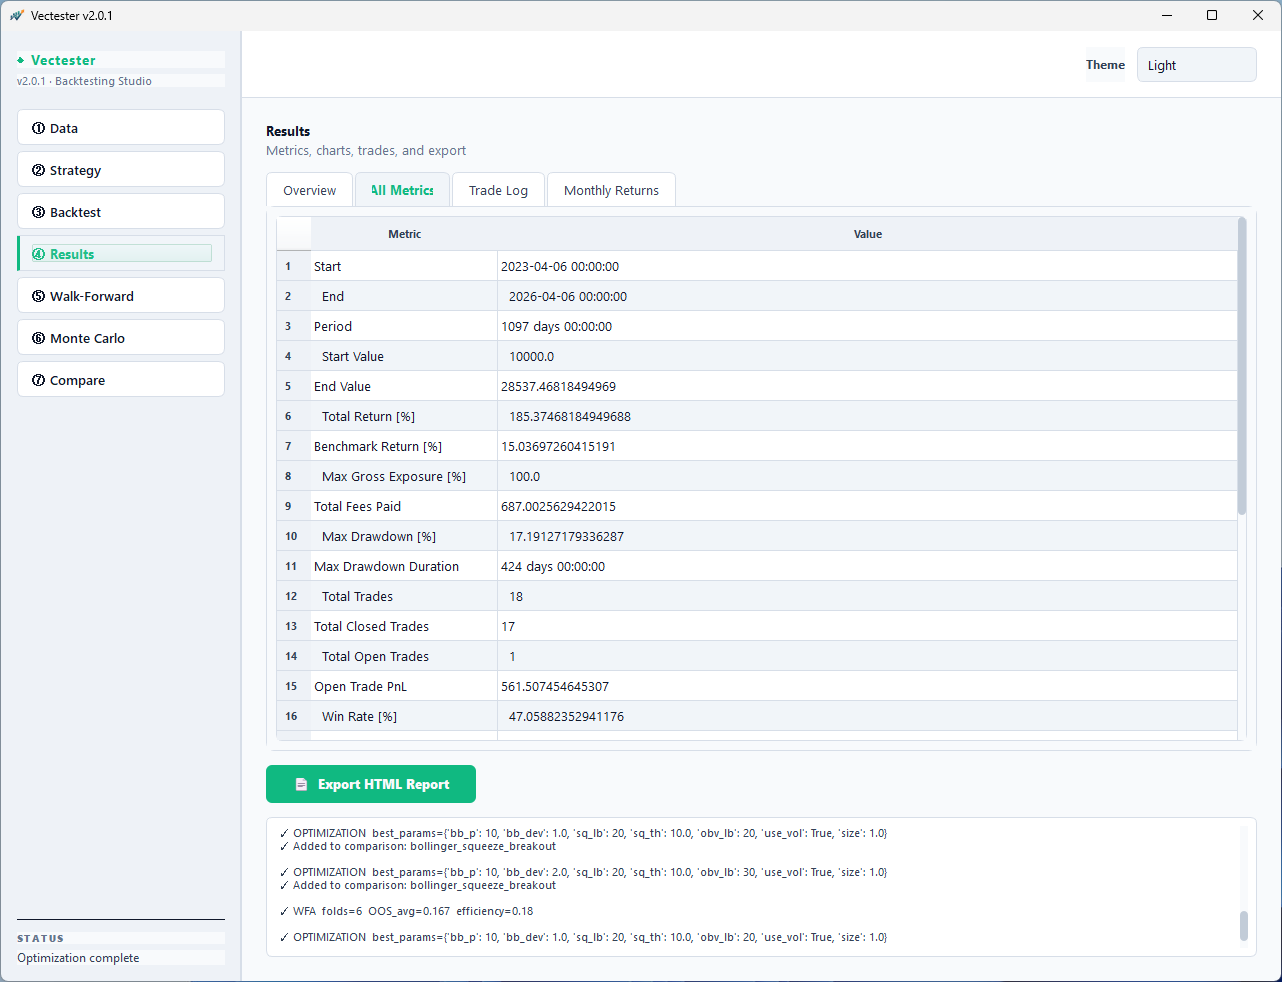
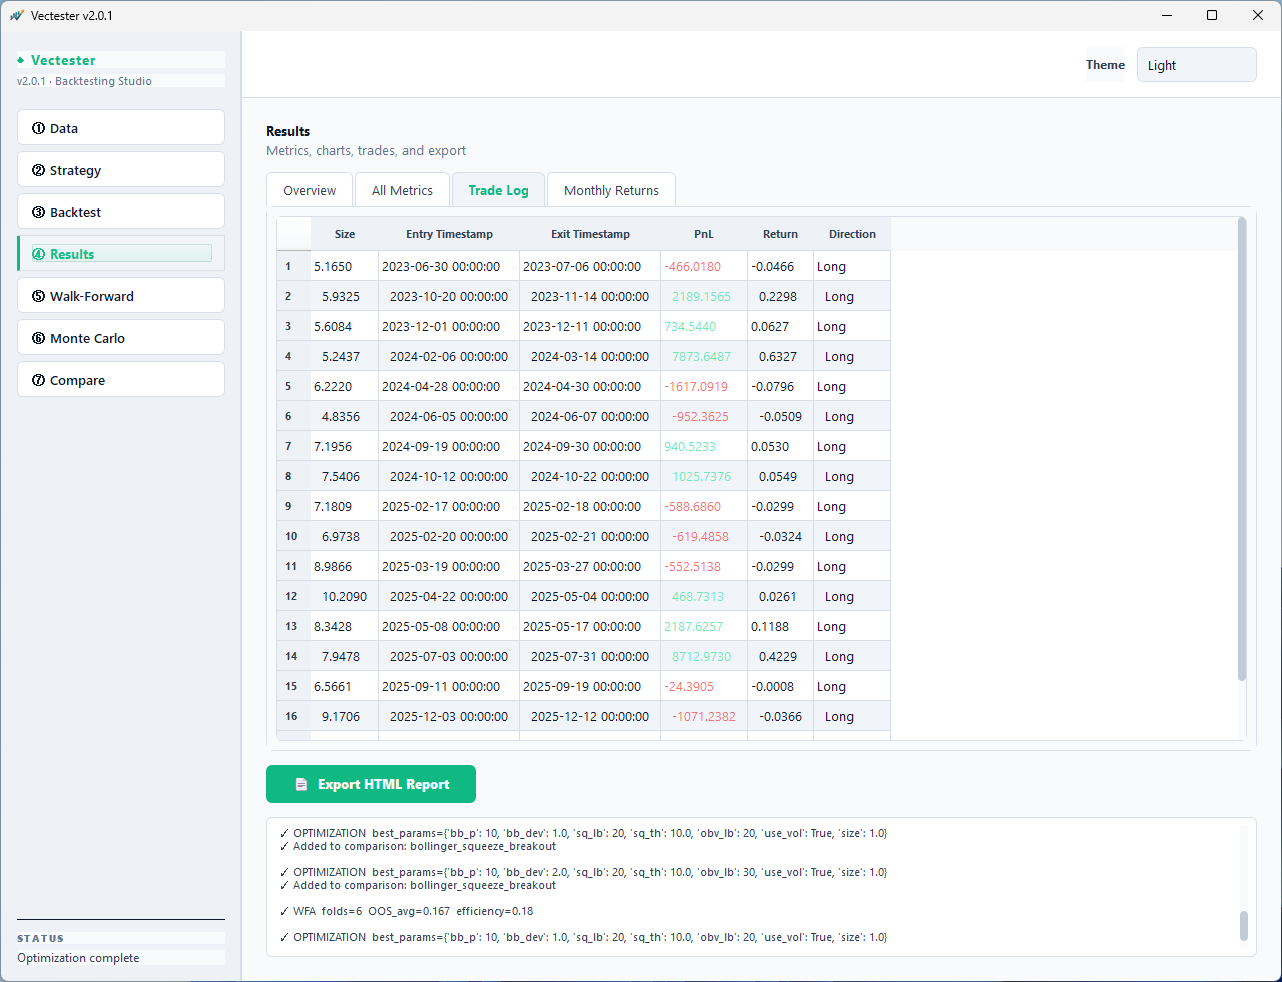
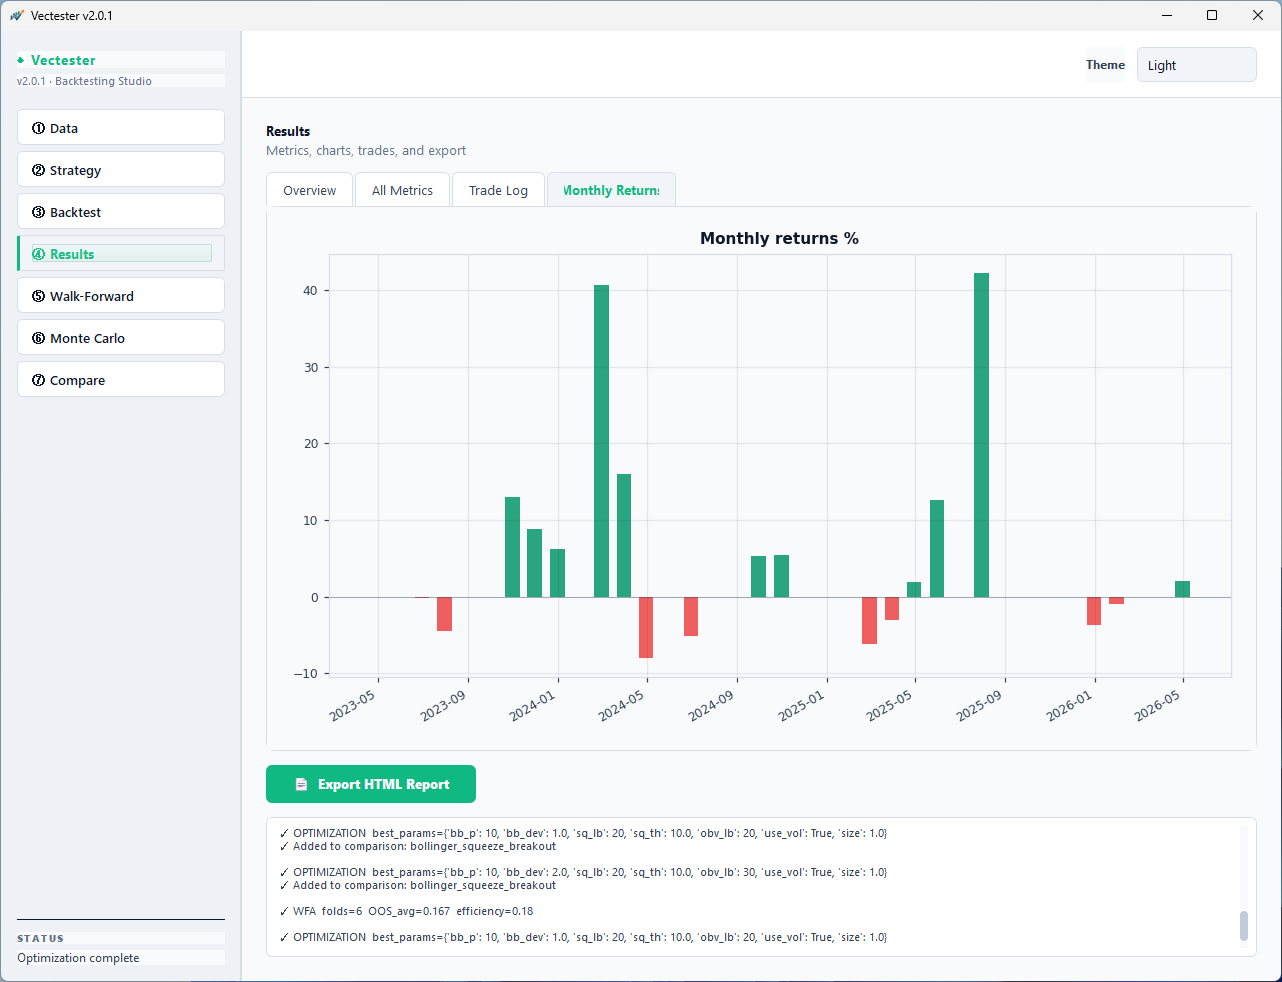
◉
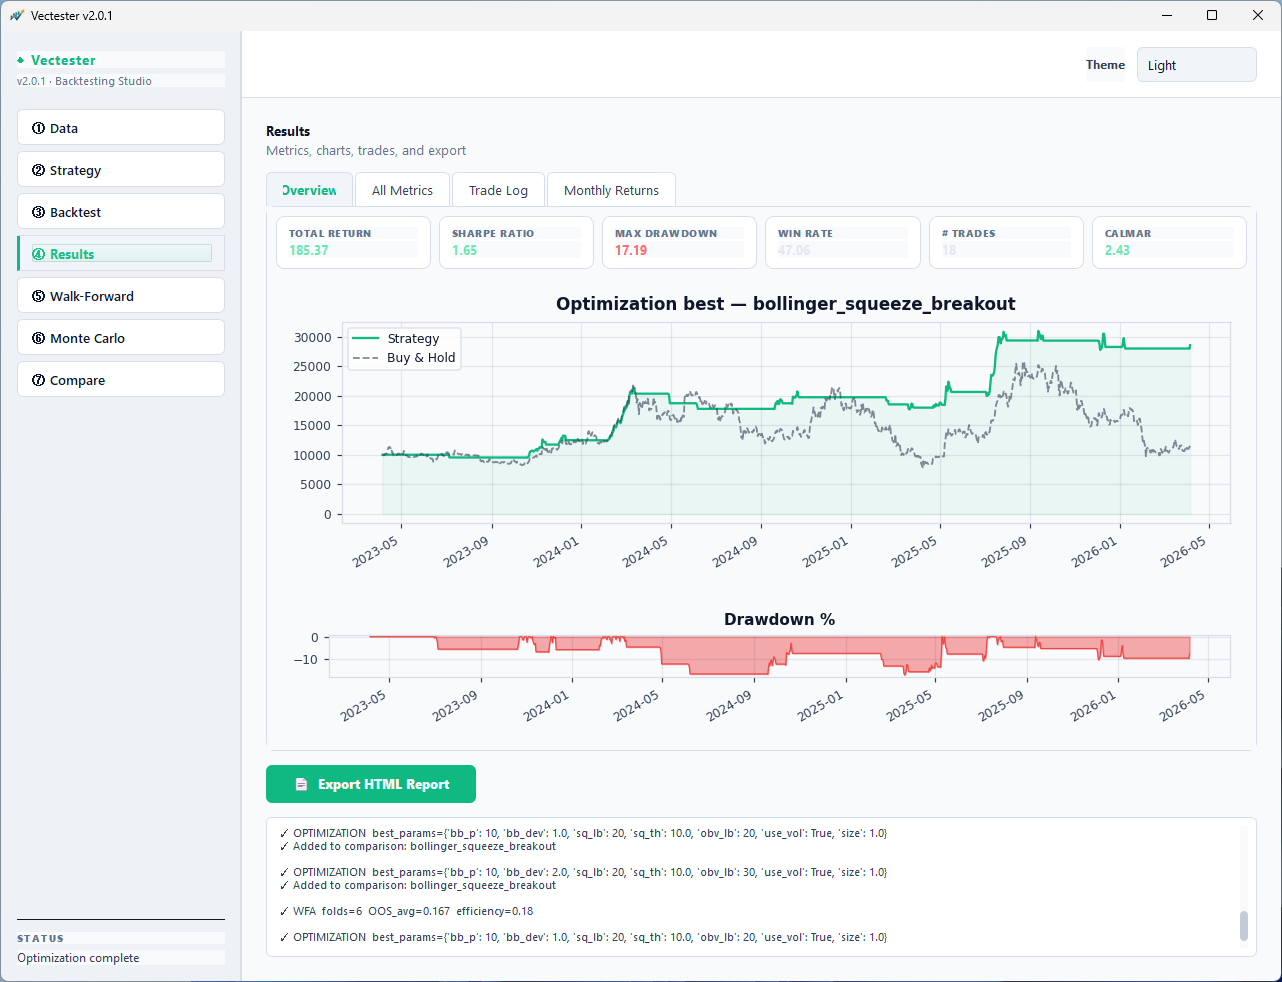
Professional Dashboard
Metric cards, equity curve, drawdown chart, monthly returns, trade log — all in a refined tabbed interface.
📄
HTML Report Export
One-click standalone tearsheet with embedded charts, Monte Carlo results, WFA folds, and full trade log. Share with anyone.